![]() Plant Metabolome Repository
Plant Metabolome Repository
Spectrum Search (MS2/MS3)
| Min Score (> 0.7): | Mode: | ||
| Max Results (<100): | MS Level: | ||
|
|
|||
| Query Spectra |
|---|
Showing 1 to 5 of 50 entries
| Hit Spectra | Score | No. | Name | MS Level | Mode | m/z | Peaks | Image |
|---|---|---|---|---|---|---|---|---|
| 1 | Tomato, Micro-Tom, peel at red stage | MS3 | pos | 536.267 | 65.9 |
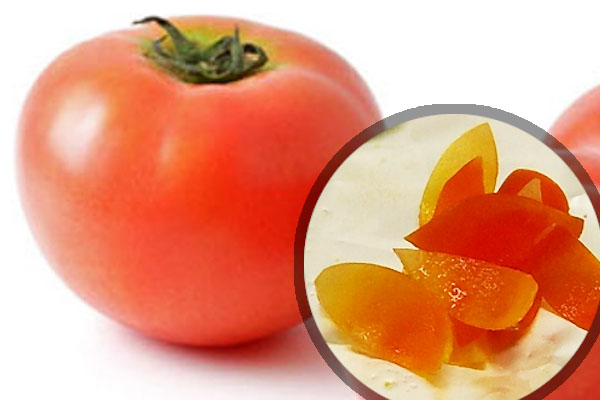 |
||
| 0.998 | Parsley, leaf | MS3 | pos | 536.268 | 65.3 |
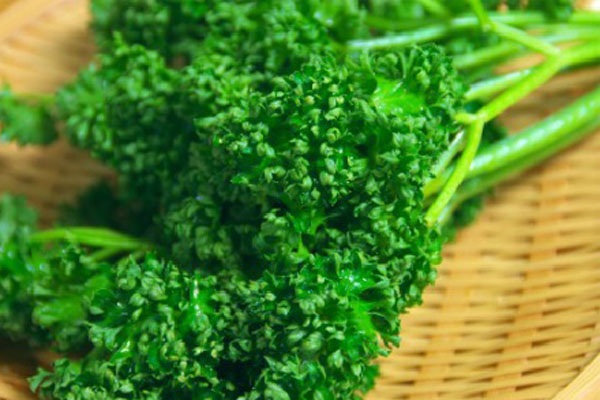 |
||
| 0.928 | Tobacco, BY-2 cell, 3 days | MS2 | pos | 483.121 | 14.2 |
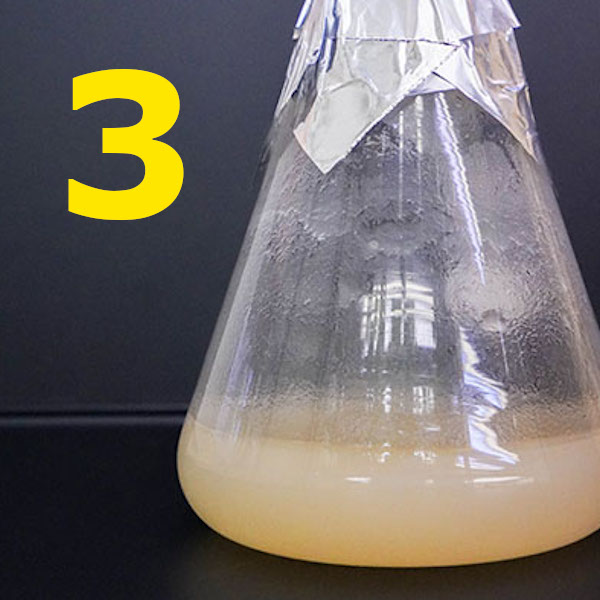 |
||
| 0.927 | Tobacco, BY-2 cell, 3 days | MS2 | pos | 483.121 | 23.9 |
|
||
| 0.923 | Parsley, root | MS2 | pos | 486.16 | 32.5 |
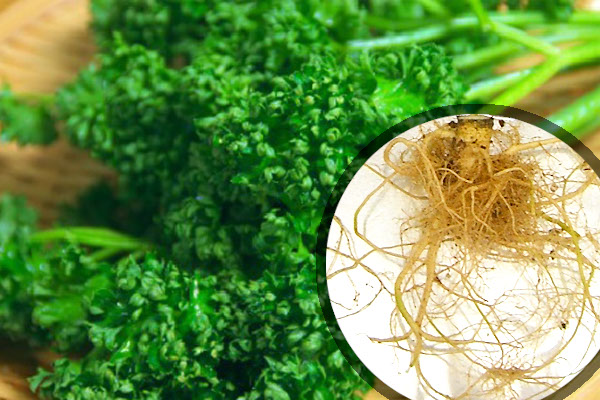 |
Showing 1 to 5 of 50 entries