![]() Plant Metabolome Repository
Plant Metabolome Repository
Spectrum Search (MS2/MS3)
| Min Score (> 0.7): | Mode: | ||
| Max Results (<100): | MS Level: | ||
|
|
|||
| Query Spectra |
|---|
Showing 1 to 5 of 100 entries
| Hit Spectra | Score | No. | Name | MS Level | Mode | m/z | Peaks | Image |
|---|---|---|---|---|---|---|---|---|
| 1 | Tomato, Micro-Tom, peel at red stage | MS2 | pos | 374.809 | 11 |
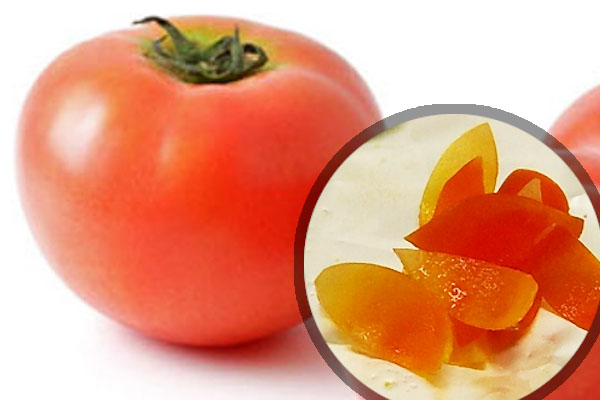 |
||
| 0.995 | Tobacco, BY-2 cell, 3 days | MS2 | pos | 374.809 | 11 |
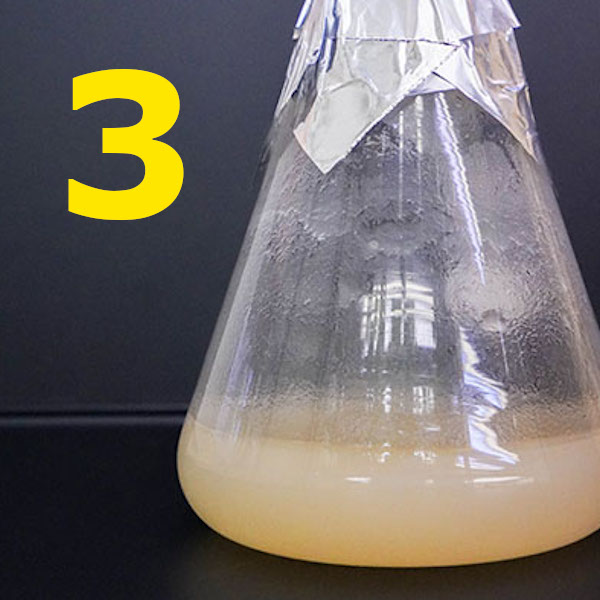 |
||
| 0.988 | Tomato, Micro-Tom, flower | MS2 | pos | 374.809 | 11.1 |
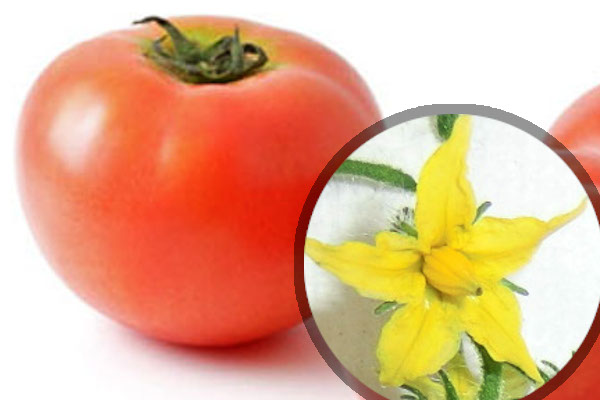 |
||
| 0.987 | Ginkgo biloba, leaf | MS3 | pos | 458.77 | 11 |
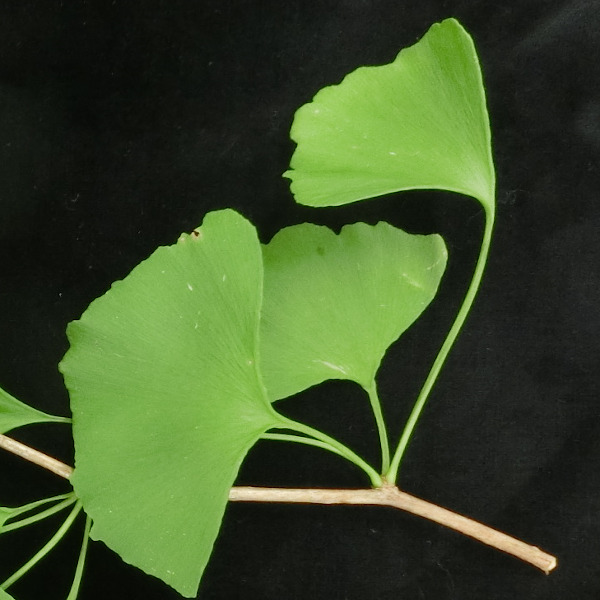 |
||
| 0.974 | Tobacco, BY-2 cell, 7 days | MS3 | pos | 458.77 | 11 |
 |
Showing 1 to 5 of 100 entries